


Rental Investors Must Properly Prioritize How They View the Costs of Being a Landlord. Here’s How
Did You Know?
That the cost of property management barely makes up 1/10th of your overall performance as a real estate investor?
What we mean by that is if you make $200K in gross income, and pay a 10% long term cost for management (a common calculation), that equals $20k deducted from monthly income at a 1 to 10 ratio.
If you secure a deep discount to 7% that’s $6k saved right? If they perform just as well yes, but how many deep discount managers do you think can deliver exceptional, long-term, consistent results, while dramatically reducing your headaches along the way?
How many property managers cutting corners and costs, hedging on investing in technology and failing to pay today’s enormous salaries to proven staff, aren’t going to have a dramatic effect on the crucial daily decisions that truly affect your cash return?
30 days wasted for any reason (vacancy, slow repairs, overpriced, not responsive to leads, poor presentation, poor condition) instantly equates to 8% less annual “gross” income. Those same things also tend to lead to poor tenants, and the poor performance spiral begins to compound. In our business time is always of the essence.
We are the ones involved in the vast majority of decisions, not unlike your surgeon. The cost of surgery is always high whether you’re dealing with the valedictorian, or the one who was last in their class. Who would choose the one that was last in their class to save a small percentage on an unavoidable expense? Or that isn’t using the most modern tools and strategies?
If we don’t drive the strategy, we can’t take responsibility for the results.
Here you find the standard performance for one of our rentals. This was a lower-end townhome in Leland NC, a relatively small town just outside Wilmington NC. This property had less than 120 days vacant over that entire time from 3/2018 – 12/2023. During that period this home had 4 different residents which is high turnover for our company, something we much prefer to avoid.
Despite being managed mostly through the nightmare of COVID lockdowns, a period when many landlords came to us utterly distraught with their management results, we cost this owner less than 5% for vacancy and less than 17% for operating expenses. Meaning we delivered 83% NOI or net operating income. This home is currently listed at the time of this writing (2/27/2024) for over $320K. Not a bad outcome for a rural market that is not considered strong.
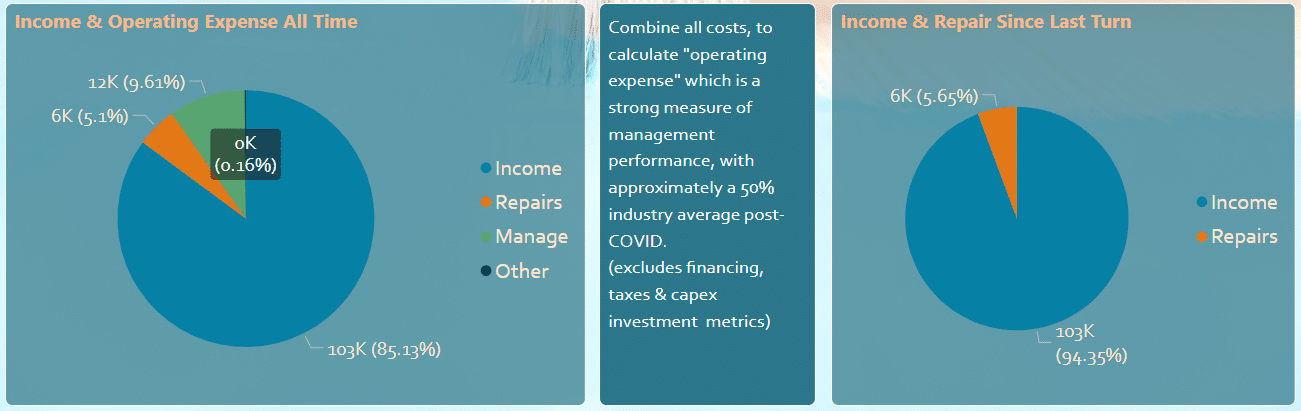
By any rational management measurement, those are phenomenal results. This investor paid our company about 10% of the income we generated as a long-term average cost, while we managed it day in and day out all through COVID lockdowns, moratoriums, vendor shortages, and more. Frankly, in our view, a manager who performs on this level could easily justify a 20% management charge because that would still multiply out to just under 75% NOI for the owner / investor, in a post-COVID environment where most owners are happy to achieve a 50% NOI.
The Pitfalls of Discount Management Providers
If you hire a discount provider and save $3K in management expenses, but end up closer to the 50% NOI that’s standard in our industry, (let’s say 70% to be fair) your net loss would be about $14,000 not accounting for what is likely to be 3-5 times the amount of vacancy our homes charge off, or approximately $103k X 20% = $20,600 – Our average 5% vacancy cost = $15,450 reduce end of year income when working with a mediocre manager. A bad one will be much worse.
Visualizing Long-Term Performance
The following example isn’t an accurate reflection of a specific statement, however, it reflects a similar situation, as well as for most of our homes. We simplified the numbers.
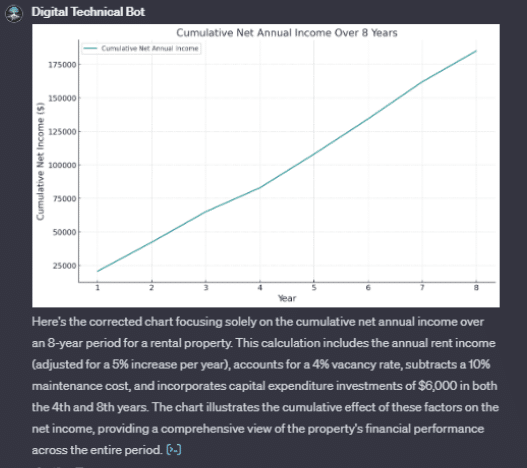
We sat down with ChatGPT and gave the following prompt. “Please present a graph from year 0 to the end of 8, that shows the cumulative net annual income performance for a rental home over 8 years, with large investments to turn the home over after the 4th, and 8th year, of $6,000 each.
Start with a $ 2,000-a-month rate and increase it by 5% per year.
Subtract 4% for vacancy cost.
Subtract 10% for repairs & maintenance costs.
Even for a seasoned rental investor and manager, it was eye-opening to see our standard performance graphed on a long-term chart, especially the tiny dips in net income required for routine updates that lead some owners to lose all sense of reality.
Comparing Management Strategies
Our mantra has always been long-term consistent results with low headaches, but we aren’t psychologists.
Building on this we further wanted to compare what a rental investor might expect in cumulative net income over 8 years from our standard performance, versus a cheaper manager who provides industry-average results (if you’re lucky).
“Please show a similar chart, if you apply a 15% management cost, then a second line if you apply a 5% management cost but have 30% more vacancy & maintenance costs.”
Disclosure: We did not run the exact math on these charts, but quick mental calculations show they are very close, and also in line with our 20 years of experience.
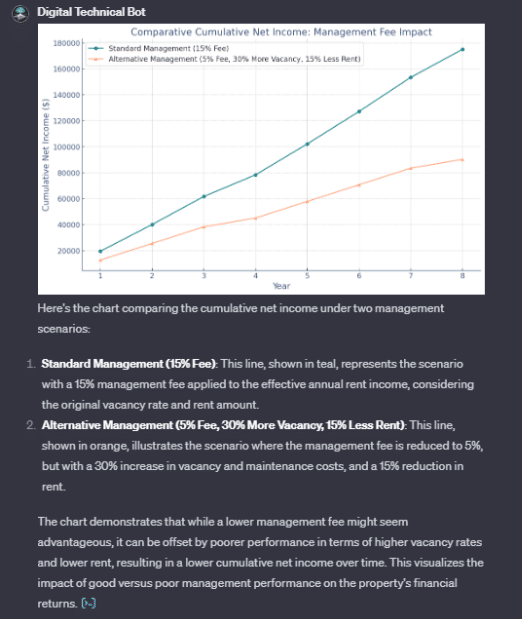
Indeed GPT, Indeed. In our business, daily performance and strategy matter immensely.
Also See: