


The Rental Headlines Are Technically True. They’re Also Missing the Point.
National rent headlines are technically accurate: March rents hit their steepest annual drop on record, down 1.7% year-over-year according to Apartment List. But those numbers are dominated by a massive wave of new apartment supply colliding with softening demand. If you own a single-family home or townhouse in the Sunbelt and you’re treating those headlines as your market signal, you’re probably making decisions based on the wrong data.
Apartments Are Not Your Competition
The structural story behind the national rent decline is straightforward: over 600,000 new multifamily units hit the market in 2024, the highest single-year supply figure since 1986. That wave is still being absorbed. Vacancy rates for apartments nationally hit 7.3% in March, the highest level since 2017. Concessions, meaning free rent or gift cards offered to attract residents, are now at their highest level in over a decade, with 16.6% of stabilized apartment landlords offering them as of January according to RealPage.
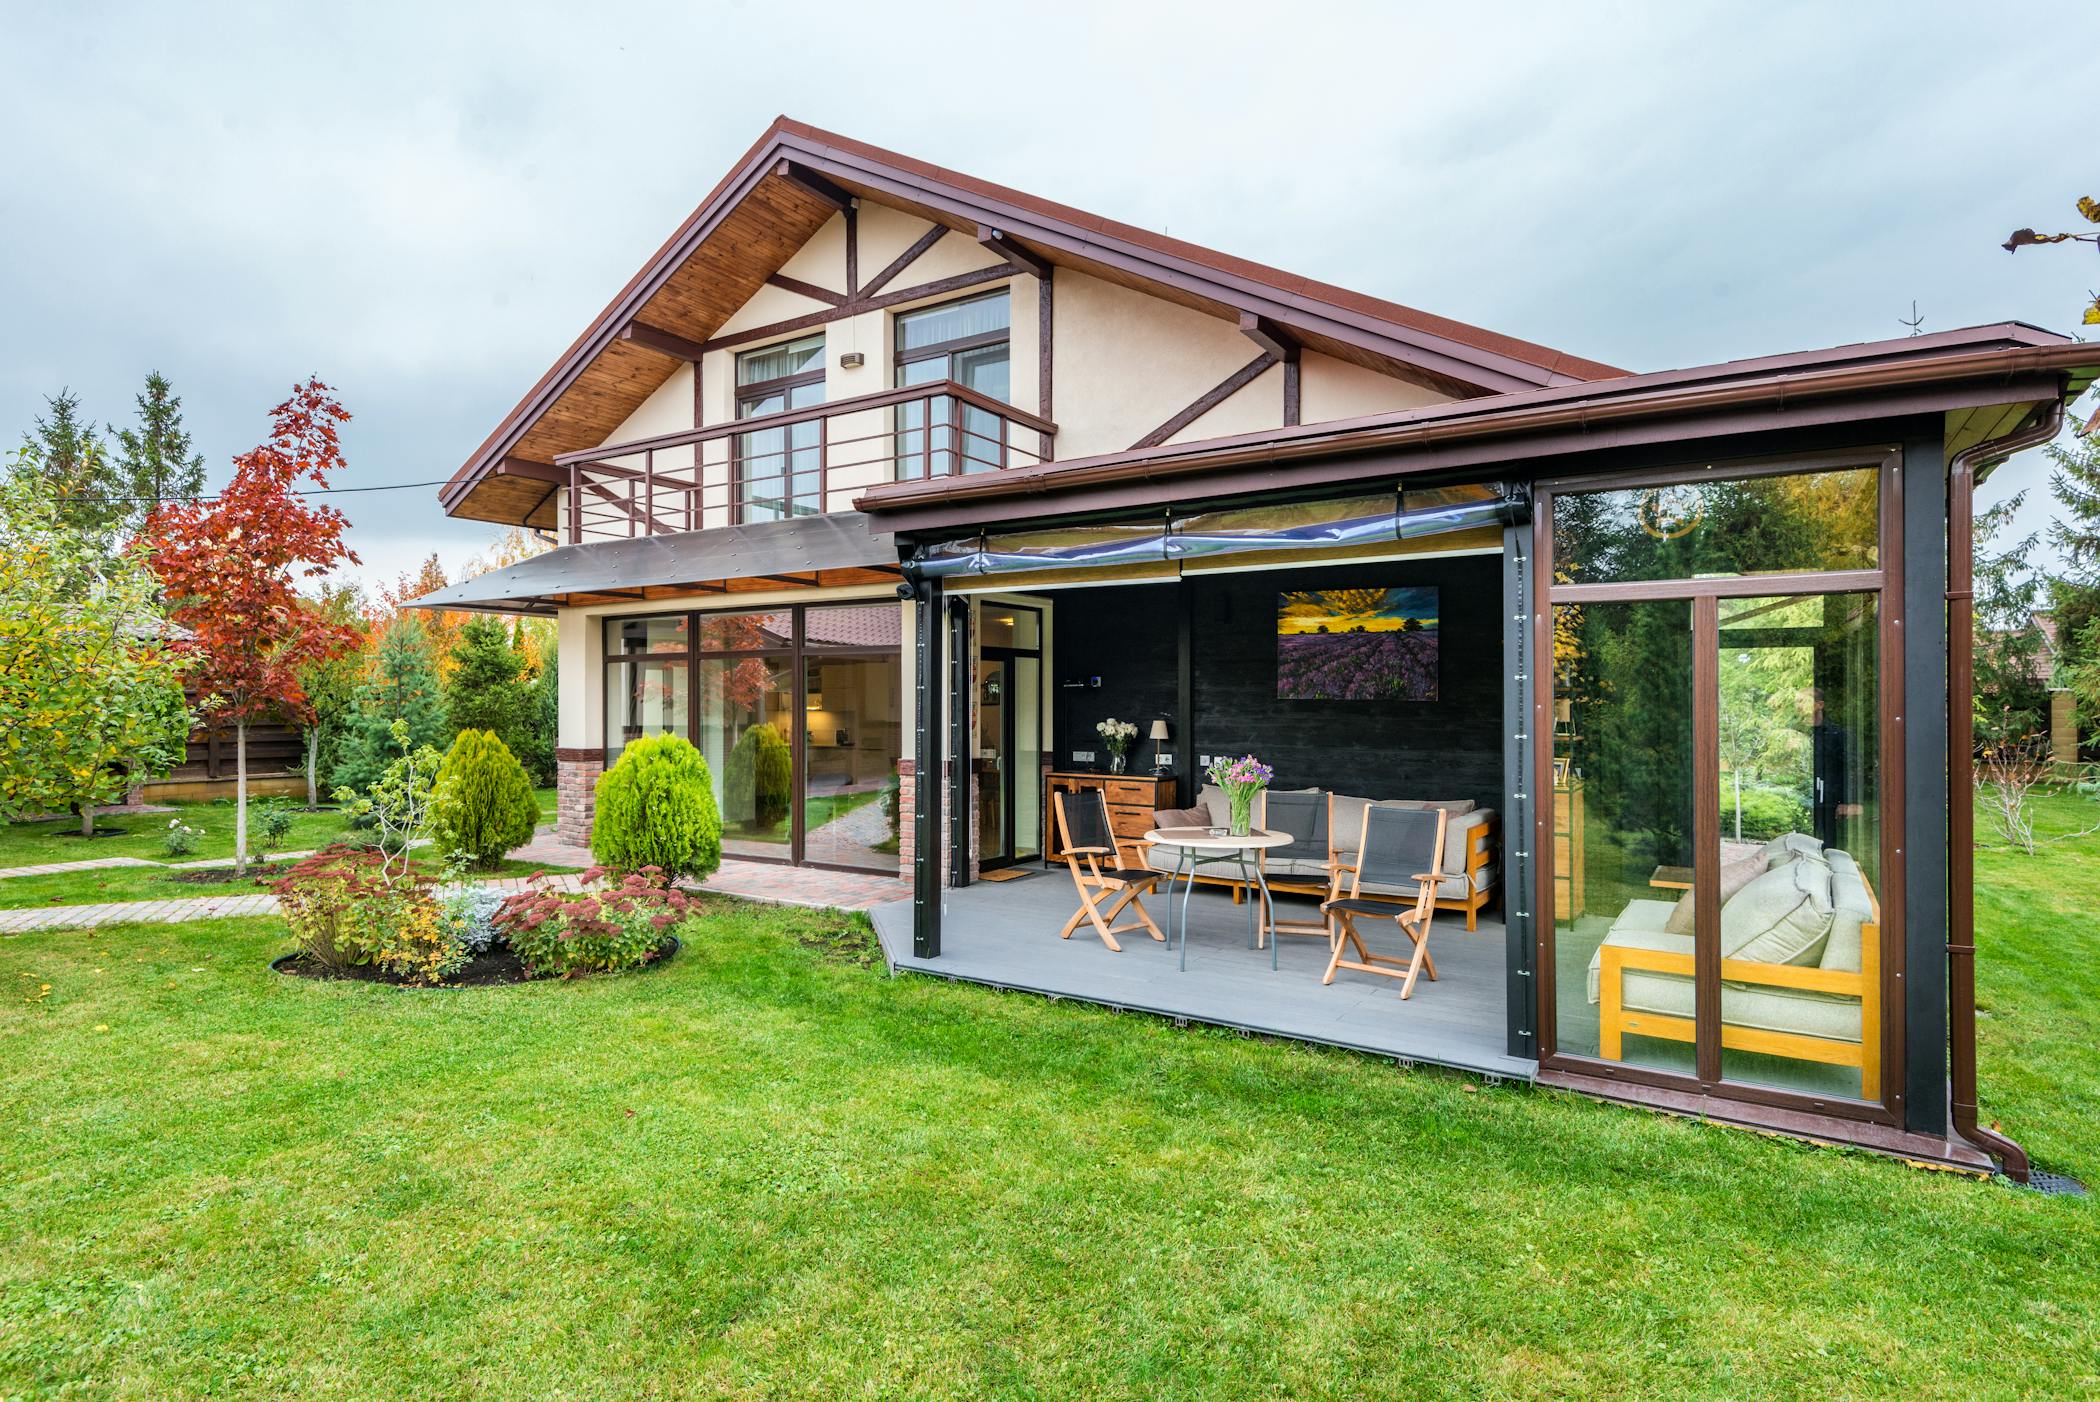
None of that is your story if you own a house or a townhouse. Single-family rentals and townhouses are operating in a meaningfully different market right now. They face less direct competition from new construction, they retain the layout and privacy advantages that apartment residents routinely pay more to access, and they tend to attract longer-tenured residents who treat the property as a genuine home rather than a temporary unit. The data reflects this. While the South overall is down 1.3% year-over-year on rents, single-family detached rentals are outperforming the apartment segment by a meaningful margin.

New Construction Has Less Edge Than It Used To
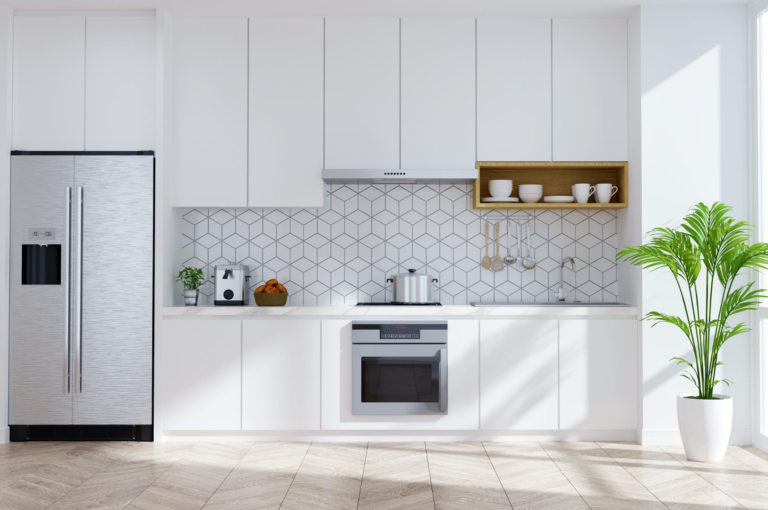
Here is something counterintuitive that we see consistently in our markets: new construction does not automatically command a premium the way it did five years ago. A brand-new build with granite countertops and stainless appliances is a strong product, but it is increasingly competing against well-renovated older homes that offer more character, established landscaping, and often better locations relative to employment centers and schools. The new construction advantage narrows considerably when the comparison is a thoughtfully updated 1990s home in a mature neighborhood versus a 2024 build in a newly cleared subdivision 15 miles from anything.
What leases fastest and holds its rate best right now in our portfolio is not the newest construction. It is the renovated or custom home where the owner invested in the right upgrades: kitchens, bathrooms, flooring, and outdoor space. That profile of property attracts the resident who has options and knows it. That resident stays longer, maintains the property better, and does not test you every 12 months on price. The math on keeping that resident happy, even at a modest discount, beats replacing them by a wide margin.
Find out what your property could rent for today
Market conditions shift faster than most owners realize. Our free rental rate estimate gives you current comps across your specific neighborhood and property type.
Get your free estimateVacancy Is Still the Biggest Self-Inflicted Wound in This Business
We have been direct about this for two years and the math has not changed. Vacancy costs between $60 and $100 per day in our markets. At the lower end, a property sitting empty for 60 days costs $3,600. At the higher end it costs $6,000. And that is before accounting for the elevated maintenance costs that empty homes carry: higher utility usage from lack of climate regulation, increased risk of unreported issues, greater exposure to vandalism and pest intrusion, and the practical reality that repair people stay busier on vacant homes than occupied ones. Nobody benefits from a vacant property except the contractors.
The decision we see property owners wrestle with repeatedly is the one that separates a home on the market for five months from one that leases in three weeks. In our portfolio, where the average single-family home rents for around $2,000 per month, that decision frequently comes down to about $200 per month, or roughly $2,400 per year. The math is not complicated. Holding out for full rate means absorbing $6,000 or more in vacancy costs to potentially gain $2,400 annually. The bird in hand is worth more than the one in the bush, and in most cases the owner ends up reducing the rate anyway after month two or three with zero to show for the wait.
The Market Is Tough. Most of the Damage Is Still Avoidable.
The Sunbelt has been among the hardest-hit regions in the country over the past two years. That is real and we are not dismissing it. But when we look closely at which properties are struggling and which are not, a pattern emerges that has less to do with the market and more to do with decision-making. Overpriced homes sit. Homes where the owner resists necessary updates sit. Homes where the resident relationship is adversarial rather than cooperative tend to produce higher turnover, more maintenance friction, and worse economic outcomes all around.
The myth that property management is simple is a significant contributor to poor outcomes in this industry. It is not simple. It is emotionally charged, legally complex, and psychologically demanding in ways that most people do not anticipate until they are in the middle of a difficult situation. The owners who do well over time are not the ones who extract maximum rent in every cycle. They are the ones who set the right priorities: attracting high-quality residents over chasing top-line rates, reducing turnover instead of nickel-and-diming their way through small disputes, and recognizing that a small discount to a qualified resident who will stay three years is one of the best returns they can generate.
$60 to $100/day
The cost of vacancy in our Sunbelt markets. See what an empty unit is actually costing you.
Calculate your vacancy cost →What the National Numbers Actually Tell You
The Apartment List and Apartments.com data is useful context but it is not a property management strategy. The Midwest is up 1.9% year-over-year. The South is down 1.3%. The Mountain region is down 2.2%. Those are averages across all property types, all price points, and all submarkets. Within those numbers, there are properties performing significantly better than the average and properties performing significantly worse. The single largest variable separating them is usually not location or property quality. It is management decisions.
If you own a single-family home or townhouse in the Sunbelt and you are operating it well, you have a defensible position right now. The apartment market headwinds are not your headwinds. The concession wave hitting institutional apartment operators does not automatically apply to your property. What does apply is the fundamental math of occupancy: an occupied home at a market-adjusted rate generates income, compounds equity, and preserves the resident relationship. An empty one does none of those things. That calculus has not changed and it will not change regardless of what the national rent index does next month.
If you want to see how your specific property is positioned relative to current comps in your neighborhood, our free rental market news and analysis covers all seven of our Sunbelt metros regularly.
A version of this article first appeared in the CNBC Property Play newsletter with Diana Olick. Property Play covers new and evolving opportunities for the real estate investor, from individuals to venture capitalists, private equity funds, family offices, institutional investors and large public companies.