


Why Single-Tool Analysis Fails Real Estate Investors
Most rental property investors make decisions using incomplete data. They might calculate cash-on-cash return while ignoring vacancy costs, or focus solely on monthly cash flow without considering how pricing strategies impact long-term profitability. This fragmented approach leads to overvalued acquisitions, poor pricing decisions, and underperforming portfolios.
Professional investors understand that successful real estate investment requires analyzing properties through multiple lenses simultaneously. Just as a physician wouldn’t diagnose a patient using only blood pressure readings, savvy investors don’t evaluate rental properties using a single metric.
The three essential perspectives every rental property investor needs:
1. Investment Performance Analysis – Is this property worth buying?
2. Vacancy Cost Modeling – Am I pricing optimally to maximize income?
3. Cash Flow Performance – Will this property generate positive monthly returns?
Vacancy Cost Calculator
We consider vacancy cost to be the worst of all costs for owners because it affects all owners, some dramatically, and is the most easily avoided of them all.
Rental Investment Cash-Flow Calculator
Input standard income and expense estimates to receive an automatic analysis of what your annual. and 5 year profit and loss performance will probably look like.
Investment Rental Property Financial Analysis
Whether you’re a seasoned real estate professional or a mom-and-pop landlord, understanding cash flow analysis is the foundation of profitable rental property investment.
Calculator #1: Investment Performance Analysis
Access the Investment Performance Calculator →
Primary Use Case: Pre-purchase evaluation and portfolio comparison
What It Measures
The Investment Performance Calculator evaluates whether a rental property makes financial sense as an acquisition. It calculates critical metrics that professional investors use to compare opportunities and establish valuation:
Key Metrics Calculated:
When to Use This Calculator
During Property Search:
Before Making Offers:
Portfolio Analysis:
Real-World Example
Scenario: $250,000 purchase price, $2,000/month rent, $50,000 down payment
The calculator reveals:
Decision Point: If your target return is 10%+ cash-on-cash, this property doesn’t meet investment criteria at this price. You’d need to negotiate down to $235,000 or find ways to increase rent to $2,150/month.
Calculator #2: Vacancy Cost Analysis
Access the Vacancy Cost Calculator →
Primary Use Case: Rental pricing strategy and marketing optimization
What It Measures
The Vacancy Cost Calculator demonstrates the hidden costs of pricing rentals above market rates. Unlike simple vacancy percentage assumptions, this calculator models how incremental rent increases add specific days to your time-on-market, revealing the true cost of aggressive pricing.
Methodology:
When to Use This Calculator
Setting Initial Rental Rates:
During Extended Vacancies:
Seasonal Planning:
Real-World Example
Scenario: $2,000 optimal market rent, considering $100 increase to $2,100
The calculator shows:
Decision Point: The $100 rent increase actually reduces total income over time. Price at market rate for faster occupancy and better long-term returns.

Learn About the Journey Catherine, Our Head of Property Management, Took from Sweden as a Teenager with Nothing but a Suitcase, to Being a Leader of Our Company: Read More
Calculator #3: Cash Flow Performance
Access the Cash Flow Performance Calculator →
Primary Use Case: Ongoing property management and operational optimization
What It Measures
The Cash Flow Performance Calculator focuses on month-to-month operational profitability. Unlike the investment calculator that evaluates purchase decisions, this tool helps property owners and managers optimize existing properties by modeling different operational scenarios.
Key Components:
When to Use This Calculator
Property Management Decisions:
Rental Rate Adjustments:
Refinancing Analysis:
Real-World Example
Scenario: $2,200 monthly rent, evaluating 10% management fee vs. self-management
The calculator reveals:
Decision Point: Self-management adds $1,320 annually, but requires an estimated 8-10 hours/month of time. If you value your time at $15+/hour, professional management provides better value.
The Power of Combined Analysis: A Complete Investment Scenario
Phase 1: Acquisition Analysis (Investment Performance Calculator)
Property Details:
Initial Analysis: Using the Investment Performance Calculator with the asking price shows 5.2% cap rate and 6.8% cash-on-cash return—below your 8% minimum threshold.
Action: Offer $260,000 to achieve target returns.
Phase 2: Pricing Strategy (Vacancy Cost Calculator)
After purchasing at $260,000, you’re ready to lease the property. Local comps range from $2,250-$2,400.
Pricing Scenarios Tested:
Decision: Price at $2,300 for optimal balance of income and occupancy.
Phase 3: Operational Management (Cash Flow Performance Calculator)
Six months into ownership, you’re evaluating operational improvements.
Current Performance:
Optimization Options Modeled:
1. Self-management: Saves $1,380 annually but requires time
2. Increase reserve fund: Better for unexpected repairs, reduces monthly cash flow by $100
3. Refinance to lower rate: Saves $85/month, costs $3,500 in fees (41-month payback)
Action: Continue professional management, increase reserves slightly, defer refinancing until rates drop further.
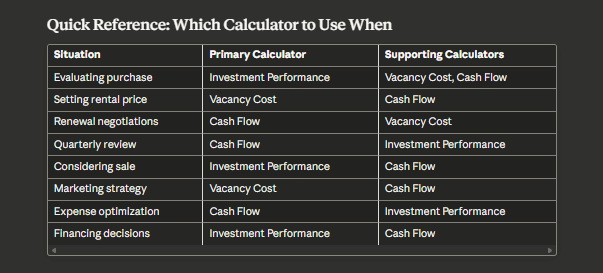
How the Three Calculators Work Together: Decision Framework
For Property Acquisition
Step 1: Investment Performance Calculator
Step 2: Vacancy Cost Calculator
Step 3: Cash Flow Performance Calculator
For Existing Properties
Quarterly Review Process:
1. Cash Flow Performance Calculator: Analyze actual operating results vs. projections
2. Vacancy Cost Calculator: Evaluate current pricing vs. market changes
3. Investment Performance Calculator: Assess whether the property still meets investment criteria (consider selling if not)
For Portfolio Optimization.
Annual Analysis:
Compare all properties across three dimensions:
Common Mistakes When Using Single-Calculator Analysis
Mistake #1: Optimistic Acquisition Analysis
Error: Using Investment Performance Calculator with overly optimistic rent and minimal vacancy assumptions.
Consequence: Property appears profitable on paper but fails to generate projected cash flow.
Solution: Validate rent assumptions with the Vacancy Cost Calculator before acquisition. Model realistic occupancy rates based on pricing strategy.
Mistake #2: Ignoring Long-Term Vacancy Costs
Error: Setting rental rates based on “what I need to make” rather than market-driven pricing.
Consequence: Extended vacancies that erode annual returns despite higher nominal rent.
Solution: Use the Vacancy Cost Calculator to understand the compounding impact of vacancy over multiple lease cycles.
Mistake #3: Operational Blindness
Error: Focusing only on acquisition metrics without monitoring ongoing operational performance.
Consequence: Expenses creep up, reducing cash flow. Miss opportunities to optimize operations.
Solution: Regular Cash Flow Performance Calculator analysis identifies expense reduction opportunities and validates management decisions.
Advanced Strategies: Integrated Calculator Analysis
The 1% Rule Validation
Many investors use the “1% rule” (monthly rent should equal 1% of purchase price) as a quick screen. Validate this rule across all three calculators:
Example: $200,000 property, $2,000/month rent
Conclusion: Property meets 1% rule on paper but optimal pricing reveals more marginal returns.
Scenario Planning for Market Shifts
Professional investors model multiple scenarios simultaneously:
Best Case (20% probability):
Base Case (60% probability):
Worst Case (20% probability):
Run all scenarios through the three calculators to understand risk exposure and minimum viable returns.
Conclusion: The Holistic Investment Approach
Successful rental property investing requires viewing properties through multiple analytical frameworks simultaneously. The three essential calculators—Investment Performance, Vacancy Cost, and Cash Flow Performance—each provide critical insights that inform better decisions:
Used together, these tools transform rental property investing from hopeful speculation into data-driven business management. They reveal the hidden costs of poor pricing, the true impact of operational expenses, and the long-term consequences of acquisition decisions.
Professional investors don’t choose between these perspectives—they integrate all three into every decision. From initial property evaluation through years of ownership, comprehensive analysis using all three calculators provides the complete picture necessary for sustainable rental property success.
Start with the Investment Performance Calculator to evaluate opportunities, validate assumptions with the Vacancy Cost Calculator, and optimize operations with the Cash Flow Performance Calculator. Together, they form the complete analytical toolkit for rental property investment excellence.