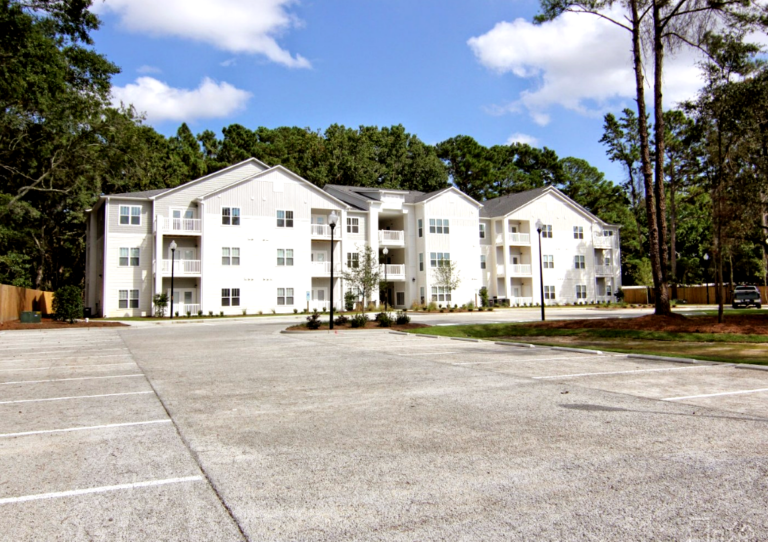
The housing market is experiencing a significant shift that hasn’t been seen in over a decade. A record 121,000 completed single-family homes sat unsold in July 2025, marking the highest inventory level since the aftermath of the Great Recession in 2009. This dramatic increase signals changing dynamics in America’s housing landscape and could create new opportunities for homebuyers in select markets.
Get a Free Virtual Rental Evaluation Plus a Custom Cost Quote
Major Homebuilders Sound the Alarm
Several of America’s largest homebuilders are expressing caution about the 2025 housing market, reporting buyer demand that’s falling short of expectations. The pullback has been particularly pronounced across key Sun Belt metropolitan areas, where affordability pressures are creating significant headwinds for potential buyers.
This shift represents a stark contrast to the pandemic-era housing boom, when inventory was scarce and competition among buyers was fierce. Now, the pendulum appears to be swinging in the opposite direction.
The Numbers Tell the Story
The trajectory of unsold completed new single-family homes paints a clear picture of the market’s evolution:
The July 2025 figure of 121,000 unsold completed new homes represents the highest level since July 2009, when 126,000 homes sat unsold during the housing market recovery.
Understanding the Supply Context
To properly contextualize these numbers, it’s important to examine the Finished Homes Supply Index—a metric that compares unsold completed new single-family homes to the annualized rate of single-family housing starts. This calculation provides insight into market tightness:
While current unsold inventory as a share of housing starts shows increased market slack compared to pre-pandemic 2019 levels, it’s worth noting that conditions are still far from the severe weakening experienced during the 2007-2008 housing crisis.
Geographic Concentration: Where the Inventory Is Building
Although the U.S. Census Bureau doesn’t provide detailed market-by-market breakdowns of unsold new builds, available data on total active inventory (including existing homes) suggests that much of this surplus is concentrated in specific regions:
Pricing Pressure and Market Dynamics
The inventory buildup is beginning to create pricing pressure in affected markets. Builders in major Florida and Texas markets are experiencing particular challenges, as these areas grapple with:
What This Means for the Market
This inventory surge represents a potential turning point in the housing market. For prospective homebuyers, particularly in affected Sun Belt markets, the increased supply could translate into:
For builders, this environment demands strategic adjustments to pricing, incentives, and construction schedules to move inventory effectively.
Important Steps to Rent Your Home Out from A to Z
Step by step checklist for getting a home rented, and link to the full property management guide
1 Consider strengths and weaknesses for your home and location and consider special strategies to utilize them. Is it a college area? If so, you’ll likely handle a lot differently from low income, or a suburb

2 Get the property in show-ready condition by handling repairs, but also low-cost aesthetic fixes like spray painting rusted AC grates, and other things that really stand out. A sure way to attract sub-par tenants and repel the rest is to show a home with unrepaired issues
3 Decide whether you’re going to allow pets or not. Before you decide, know that for most landlords it’s the single best thing you can do to increase your “bottom line” profit over the long term. More on this subject here

4 Set a rental rate that will balance a minor amount of time on market hassle, with monthly rate. Whether in the form of owner-occupied showings, stress, or vacancy. Most owners fail to properly account for these subtle but real costs, especially vacancy. Vacant homes are much more costly than most account for. We can provide a free rental rate estimate compiled by people, not an algorithm, here
Looking Ahead
The current inventory levels suggest that the housing market is transitioning from the seller-favored conditions of recent years toward a more balanced environment. While we’re not approaching the severe oversupply conditions of 2008-2009, the trend indicates that buyers may find more favorable conditions in select markets.
As affordability remains a key challenge, the interplay between inventory levels, pricing adjustments, and buyer demand will be crucial factors to watch in the coming months. For those considering a home purchase in affected markets, this could represent the most favorable buying environment in several years.
To read more, visit Builders face glut as unsold homes pile up – Fast Company.


