


Market Analysis · August 2026
The Seasonal Rental Cliff Is Here: New Data Shows Why Reducing Now Saves Thousands
Apartment List just published their July 2026 national rent report, and the news for property owners across the Carolinas is stark. Charlotte (and most of the sunbelt) ranks among the worst-performing rental markets in the country. The entire Sunbelt, which encompasses every market we operate in, is actively dragging down the national average. If your property didn’t rent in July, the seasonal clock is already working against you.
We’ve been sounding this alarm for years, but we largely expected this year to be the bottom. However as interest rates have drifted higher, the rental market has steadily drifted lower. The window for action is narrow once August arrives, and the cost of inaction is measured in thousands of lost dollars.
Charlotte and the Sunbelt: The Numbers Speak

It’s been pretty shocking to us also, how can some of the fastest growing cities in the country see 3 years of rental declines? Years of aggressive apartment construction across the Sunbelt finally caught up with pandemic-era demand. Charlotte alone saw thousands of new units delivered in 2024 and 2025, and that supply creates direct competition for all single-family rentals. Your property isn’t just competing with other houses. It’s competing with brand-new apartments offering two months free, waived deposits, and amenity packages that didn’t exist three years ago. Add to that how much more costly and time consuming it is to manage a house today versus an all inclusive condo. It creates a type of spiral where condos suffer and cut prices, lower quality houses are forced to follow and within 12 months or so the temptation to save money (as costs rise) begins to pressure the highest quality houses. We’ve seen a similar trade off in the city versus the suburbs. The burbs boomed during COVID, but we’ve seen a dramatic reversal in that city center rents we thought we would never see again are pulling a lot of renters out of the suburbs and back to the city. Since rental inventory is so high, that demand fails to increase prices.
The owners who recognized this shift early and priced accordingly have fared well. The ones still anchored to 2022 rental rates are the ones calling us in October wondering why their home has been empty for three months. We often see a similar annual mistake where owners price their September rental based on summer prices but back to school season is the worst time of year for a lot of rentals. It makes no sense to fail to respond to such a well documented market shift.
The Seasonal Pattern Never Lies
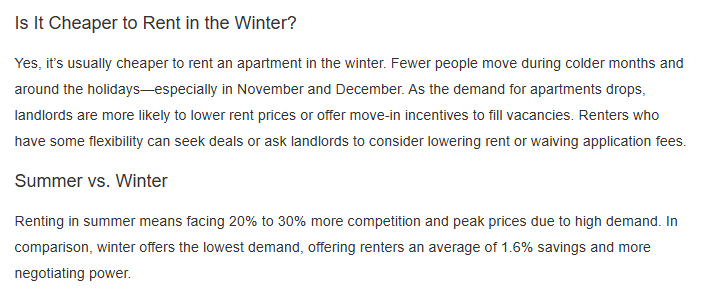
Every year, the rental market follows a cycle that’s as reliable as the calendar itself. Demand peaks in late spring and early summer, begins its decline in August, and by October, the market has fundamentally shifted. It’s visible in every data source we track, yet seems to almost never enter the lexicon in the single-family industry.

Apartment List’s search volume data shows the decline beginning each August and accelerating through fall. When fewer people are searching, your pool of qualified applicants shrinks, your time on market increases, and your negotiating position weakens. Every week you wait compounds the problem.

Average monthly rent changes follow the same pattern. Rents rise through spring, plateau in mid-summer, and start declining in August. If you’re holding out for summer pricing in September, you’re holding out for a ship that sailed weeks ago.
Relative Renter Search Demand by Month
Based on Apartment List search data and 20 years of MoveZen leasing activity. Hover bars for detail.
Every Peak, Every Year, Is August
This next chart makes the case more powerfully than any argument we could write. Look at median rents nationally from 2017 through today. Pick any year. The peak, without exception, occurs in August. After that, prices decline through winter, bottoming out between December and February.

This is not a COVID artifact, it’s the fundamental rhythm of the rental market, driven by school schedules, job relocation timing, and lease cycles. It has been this way in our markets for at least 30 years. Every day you wait past August to adjust pricing, the market is adjusting it for you.
$67 per day
That’s what vacancy costs on a typical $2,000/month rental, before utilities, lawn care, and maintenance risk. The meter is running.
See the latest market data for your area →Our Data Tells the Same Story
Data doesn’t lie, but the way it’s presented can. In this case it’s a very simple set, our total website impressions. Our website traffic paints the same picture in vivid detail across North Carolina and South Carolina. Due to our data-centered and highly-experienced commentary on the rental market over the past few years nearly 60% of our website traffic is from national landlords reading our articles, so these steep drop offs are actually less extreme than they used to be when most of our traffic was due to local renters. This almost overnight decline occurred at some point in early fall every single year.

In 2025, we got somewhat fortunate. The market stayed relatively active through Labor Day, longer than usual, largely because rental rates had become so compelling that value-hunting residents extended the traditional season. But the decline came. It always does. We are desperately hoping for a similar pattern this year because we have a record number of vacancies due to owners borderline rebelling against current low rates. This article is our hail mary.

The 2024 pattern was even more abrupt. Traffic dropped at mid-July. Contracts signed followed immediately. Homes that weren’t leased by early August entered a very different market: fewer applicants, more competition from desperate price-cutters, and less leverage for owners.
What’s Vacancy Actually Costing You?
Adjust the sliders to see the real numbers for your situation
Annual Cost of Reducing
$1,200
Cost of Vacancy
$2,000
You save $800
by reducing now, before carrying costs, maintenance risk, and lost quality applicants
The Math That Changes Minds
Here’s the calculation that changes minds every time we walk a property owner through it. A $100 per month rent reduction costs $1,200 over a full year. That’s real money. But 30 days of vacancy on a $2,000 per month rental costs approximately $2,000 in lost income. That’s before you factor in $150 to $200 per month in carrying costs for the vacant property: utilities, lawn service, pool maintenance, increased insurance exposure, and the heightened risk of mechanical failures in an unoccupied home. Unused HVAC systems and water heaters fail at dramatically higher rates, and we’ve learned that lesson more times than we’d like to admit.
So the real question isn’t whether you can afford to reduce by $100 a month. It’s whether you can afford not to.
Two Scenarios, One Clear Answer
Reduce $100/Month
$1,200
Annual cost of reduction, spread across 12 months
30 Days Vacant
$2,000+
Lost income in just one month of vacancy
Utilities you’re now paying ($150+/month)
Lawn care, pool service on an empty property
Higher risk of HVAC and water heater failure
Lost opportunity to attract quality applicants during peak season
Likely 10%+ eventual reduction anyway after months of sitting
And here’s where the math gets truly serious. Our 20 years of data tell us that most homes still vacant on September 1st are still vacant on December 1st. That’s not 30 days. That’s 90+ days of lost income: roughly $6,000 on that same $2,000 property. Compare that to the $1,200 annual cost of a modest reduction, and it’s not even close.
Most homes vacant on September 1st are still vacant on December 1st. That’s $6,000+ in lost income that a $100/month reduction could have prevented.
Run the numbers for your property
Our vacancy cost calculator shows exactly how much an empty unit drains from your bottom line, week by week, month by month.
Calculate your vacancy costQuality Residents Find Value, and That’s the Point
The counterintuitive fact that separates thriving property owners from struggling ones is that a competitive rental rate doesn’t attract lesser quality residents. It attracts much better ones who are more likely to stay put, follow the rules, care for the home, not cause hoa issues, not swap roommates every 4 months etc etc. Fighting for a top line rate these days almost guarantees everything else will be much harder.
“A lower rent will attract lower-quality residents.” FALSE. Great residents have great finances for a reason. They comparison shop. They run the numbers. They know what their 750+ credit score entitles them to, and they use it. When you price competitively, you’re putting your property in front of exactly the applicants you want: financially stable, responsible, and intentional about their housing choices. They find value because they’re smart enough to recognize it.
When you overprice, you sit vacant for two or three months, then reduce by 10% or more anyway, and you take whoever’s left in the applicant pool. Those aren’t the value hunters with 780 credit scores. Those are often the applicants who couldn’t qualify for the competitively priced listings. Johnny isn’t selling his lemonade for $8 if Sally is selling the same basic thing around the corner for $6. You focus on the market and your customers and right now the winning play is not getting top of the line rents. Not even close. It is though a massive red herring for millions of landlords every year.
AppFolio’s own industry research reinforces this point directly. Their data shows that resident retention, keeping quality residents in place through competitive renewals, is among the highest-ROI strategies available to property owners. The combined cost of turnover (vacancy, marketing, make-ready expenses, leasing fees) dwarfs the cost of a modest renewal concession. A resident who stays three years at $50 below peak market rate generates far more net operating income than three one-year residents at top-line rent with two turnovers and two vacancy periods between them.
These themes have been a cornerstone of our approach since our founding, and especially since the post-COVID market made everything in this industry harder and more expensive. The data keeps confirming what we learned in the trenches years ago: invest in quality residents, price for the market you’re actually in, and play the long game. If you’re weighing the numbers for your property, our free rental rate estimate can show you exactly where the market sits right now.
The Cost of Waiting: What Happens Month by Month
Click any month to see the full impact. Adjust rent to match your property.
August
$2,000
5-10% overpriced, demand dropping fast
September
$4,000
15-20% overpriced, schools in session
October
$6,000
Deep discounts needed, few quality applicants
November
$8,000
Market near standstill, holiday season
December
$10,000
Lowest demand of the year, maximum lost income
Total Lost Income: August Through December
$10,000
vs. $1,200 annual cost of a $100/month reduction
$0
Average lost income, Aug to Nov vacancy
$0
Annual cost of $100/mo reduction
0
Years of seasonal data confirming this pattern
We’ve Been Here Before: The December to Remember
A Case Study in Decisive Action
In late 2023, we faced a situation remarkably similar to today. The market was slow. Traffic was falling. By Thanksgiving, we had roughly 30 vacant homes with minimal activity. The usual fall bounce had arrived later than in our 20-year history, and owners were understandably reluctant to adjust prices.
Our leadership team ran the numbers, and the picture was alarming. Without swift action, owners stood to lose over $45,000 in December alone. With January and February being the slowest months historically, total projected losses from vacancy approached $120,000.
We went into what we call red alert mode. Operations teams visited every vacant property. We checked for deferred maintenance issues, re-shot listings with our best photographer, updated descriptions and market positioning, implemented strategic price reductions that had been held back, and launched aggressive social media campaigns. We invested nearly 20% of our annual marketing budget in the three weeks between Thanksgiving and Christmas.
By Christmas, we had rented nearly every struggling vacant home. Most were leased to high-quality residents who timed their moves strategically to find value. We estimated an additional $100,000 to $150,000 in rent income that would have been lost to extended winter vacancy.
That’s the power of decisive, data-backed action. And that’s exactly what we’re urging property owners to consider right now, before August turns into September, and September turns into another winter of lost income.
Read the full December to Remember story →The seasonal cliff is here. The national data confirms it. Our local data confirms it. The math confirms it. The question isn’t whether prices will decline from here; they will, as they always do after August. The question is whether you’ll get ahead of it or spend the next four months chasing a market that’s moving away from you.
Find Out Where Your Property Stands
Get a free, no-obligation rental rate estimate based on current market conditions in your area. Know the number before making the decision.
Get Your Free EstimateCalculate your vacancy cost · Latest market data · Free rental estimate